|
Extension
|
| Interface | |
| Transfer of Technology Programmes | |
| Exhibitions, Melas, Field days | |
| Agricultural Technology Information Centre | |
|
Socio-economic Impact Studies
|
||
|
Impact Of Different
Mariculture Technologies of CMFRI
|
||
|
Projects
|
Fishery Enterprises
Through Shgs
|
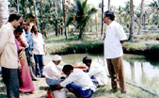
Participatory
Rural Appraisal
|
| Transfer of Technology Programmes | ||
| Learning through participation |
 |
|
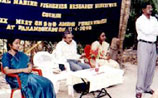
| Fishermen-Farmers-Industry-Institution-Meets | ||
| Training Programmes | ||
| Fisheries-based Micro Enterprises through SHGs | ||
| Exhibitions, Melas, Field days | ||
| Post Graduate Programme Research Guidance Visiting Faculty in Fisheries Economics & Extension | ||
| Agricultural Technology Information Centre | ||
 |
 |
 |
| Women Empowerment and Gender Issues | |
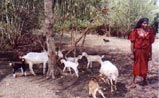
| Occupational hazards of fisherwomen
Ergonomic studies
Entrepreneurial skill development Role of women in fisheries Gender disparity in wage pattern Labour segmentation Extent of technological marginalisation. |
|
| Institute-Village-Linkage-Programme for Technology Assessment and Refinement in the Coastal Agro- Eco system of Ernakulam in Kerala | |||||||||||||||||||
 |
|
||||||||||||||||||
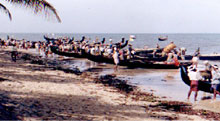 |
Value of marine fish at consumer level - Rs. 20,000 crores (1999-2000) Export earnings - Rs. 6300 crores (2000-01) Rs. 4.5 crores (1960-61) 85% of the catch for internal consumption and rest exports. |
| Marine fishermen households - 5 lakh (1999) 3.5 lakh (1980) Ownership on fishing equipment.(2001) only 23% of the active fishermen Per capita production per active fishermen declined from 3250 kg in 1980 to 2240 kg in 2026 . Non-mechanized sector is surviving and sustaining only as a family enterprise |
| Marine Fisheries in India- Socio-economic Profile | |
| Marine fishermen population - 3 million | |
| Marine fishermen households - 0.50 million | |
| No of active fishermen - 1.025 million | |
| Ratio of active fishermen to total - 1:3 | |
| Average no. of sea-going fishermen per village - 282 | |
| Average no. of fishermen population per village - 825 | |
| Fish landing centres - 2251 | |
| Marine fishing villages - 3638 | |
| Publications | ||||||||||
|
 |
|||||||||
 |
 |
|||||||||
|